Foundations: Market Structure & What The Heck Just Happened
The Type of Read that Grants the Reader not only Understanding but Air Superiority

2011-2026 is special.
Our latest fifteen-year block, the S&P 500 has delivered a 12.09% annualized real total return with a dividend contribution of only 1.76%. That dividend contribution is at the 1st percentile across 145 years of every conceivable 15-year block.
Anti-dilutive buybacks plus restricted stock unit (RSU) withholding tax are real cash uses that clearly compete directly with dividend policy.
The S&P 500 companies have in fact been replacing the dividend, the only non-reversible component of shareholder return (the others being earnings growth and earnings multiple expansion), with a cash transfer to employees that does not appear in earnings, does not appear in typical free cash flow calculations, and often indirectly contributes to an increase in share count.
That said, earnings growth has been the argument, the big contributor.
This is what brings the question of earnings quality and earnings permanence to the core. To the extent the earnings have a cyclical component, perhaps, or an enhanced component, this would be good to know.
As such, I have dealt extensively with earnings quality, competitive dynamics, and various other issues covering the fundamental basis for valuing companies, and where they trade today. These are the factors that matter most over the long term.
The market has been resilient like no other market in history. I will get to that in a moment, but it is remarkable in a sense, given stockholders are treated to so little in the way of actual dividends from their investments.
The old saw about whether Microsoft would ever be worth anything at all if it never paid a dividend before finally petering out, well, no one talks like that anymore.
As mentioned, 2011-2026 is special.
Of course, with respect to overall market health and the forces therein, I covered both fundamental and technical factors, as well as how this may change in the future, in Foundations: U.S. Market Structure & Value earlier this year.
Foundations: U.S. Market Structure & Value

As you know, many on CNBC and across the social media spectrum are very excited about AI and the potential for very high stock valuations continuing and even expanding.
Here, however, I will take a different, and perhaps unexpected, turn to the question of what’s gotten into markets, and how our markets compare to those of previous eras.
The hope being, an investor can learn something from the endeavor.
Typically, when one faces one’s fears, one does.
Now, finally, it is time I face my nemesis, the Greeks.
Market Volatility
If one knows me, one knows I love Greek food, love the Greek people (at least the ones I know), and never ever use the Greeks in my investing approach. I have rejected beta, alpha, theta, feta, pita, you name it. They have no place in what I do when it comes to analyzing stocks, options, and bonds as investments.
Nevertheless, I have found the market today very different than the one on which I cut my teeth nearly 40 years ago.
As I have endeavored to put my finger on exactly how markets have changed, I have made some helpful discoveries and opened new avenues for inquiry.
In light of the last few days – a big sell-off in the Momentum Pair trade and then an even bigger rebound in the Momentum Pair trade – I am motivated, finally, to look at all this from a volatility standpoint.
For that I first turn to three non-Greeks.
Glosten, Jagannathan and Runkle (GJR, as I am not averse to acronyms) in 1993 looked into how markets react to up days and down days and published their findings in the Journal of Finance.
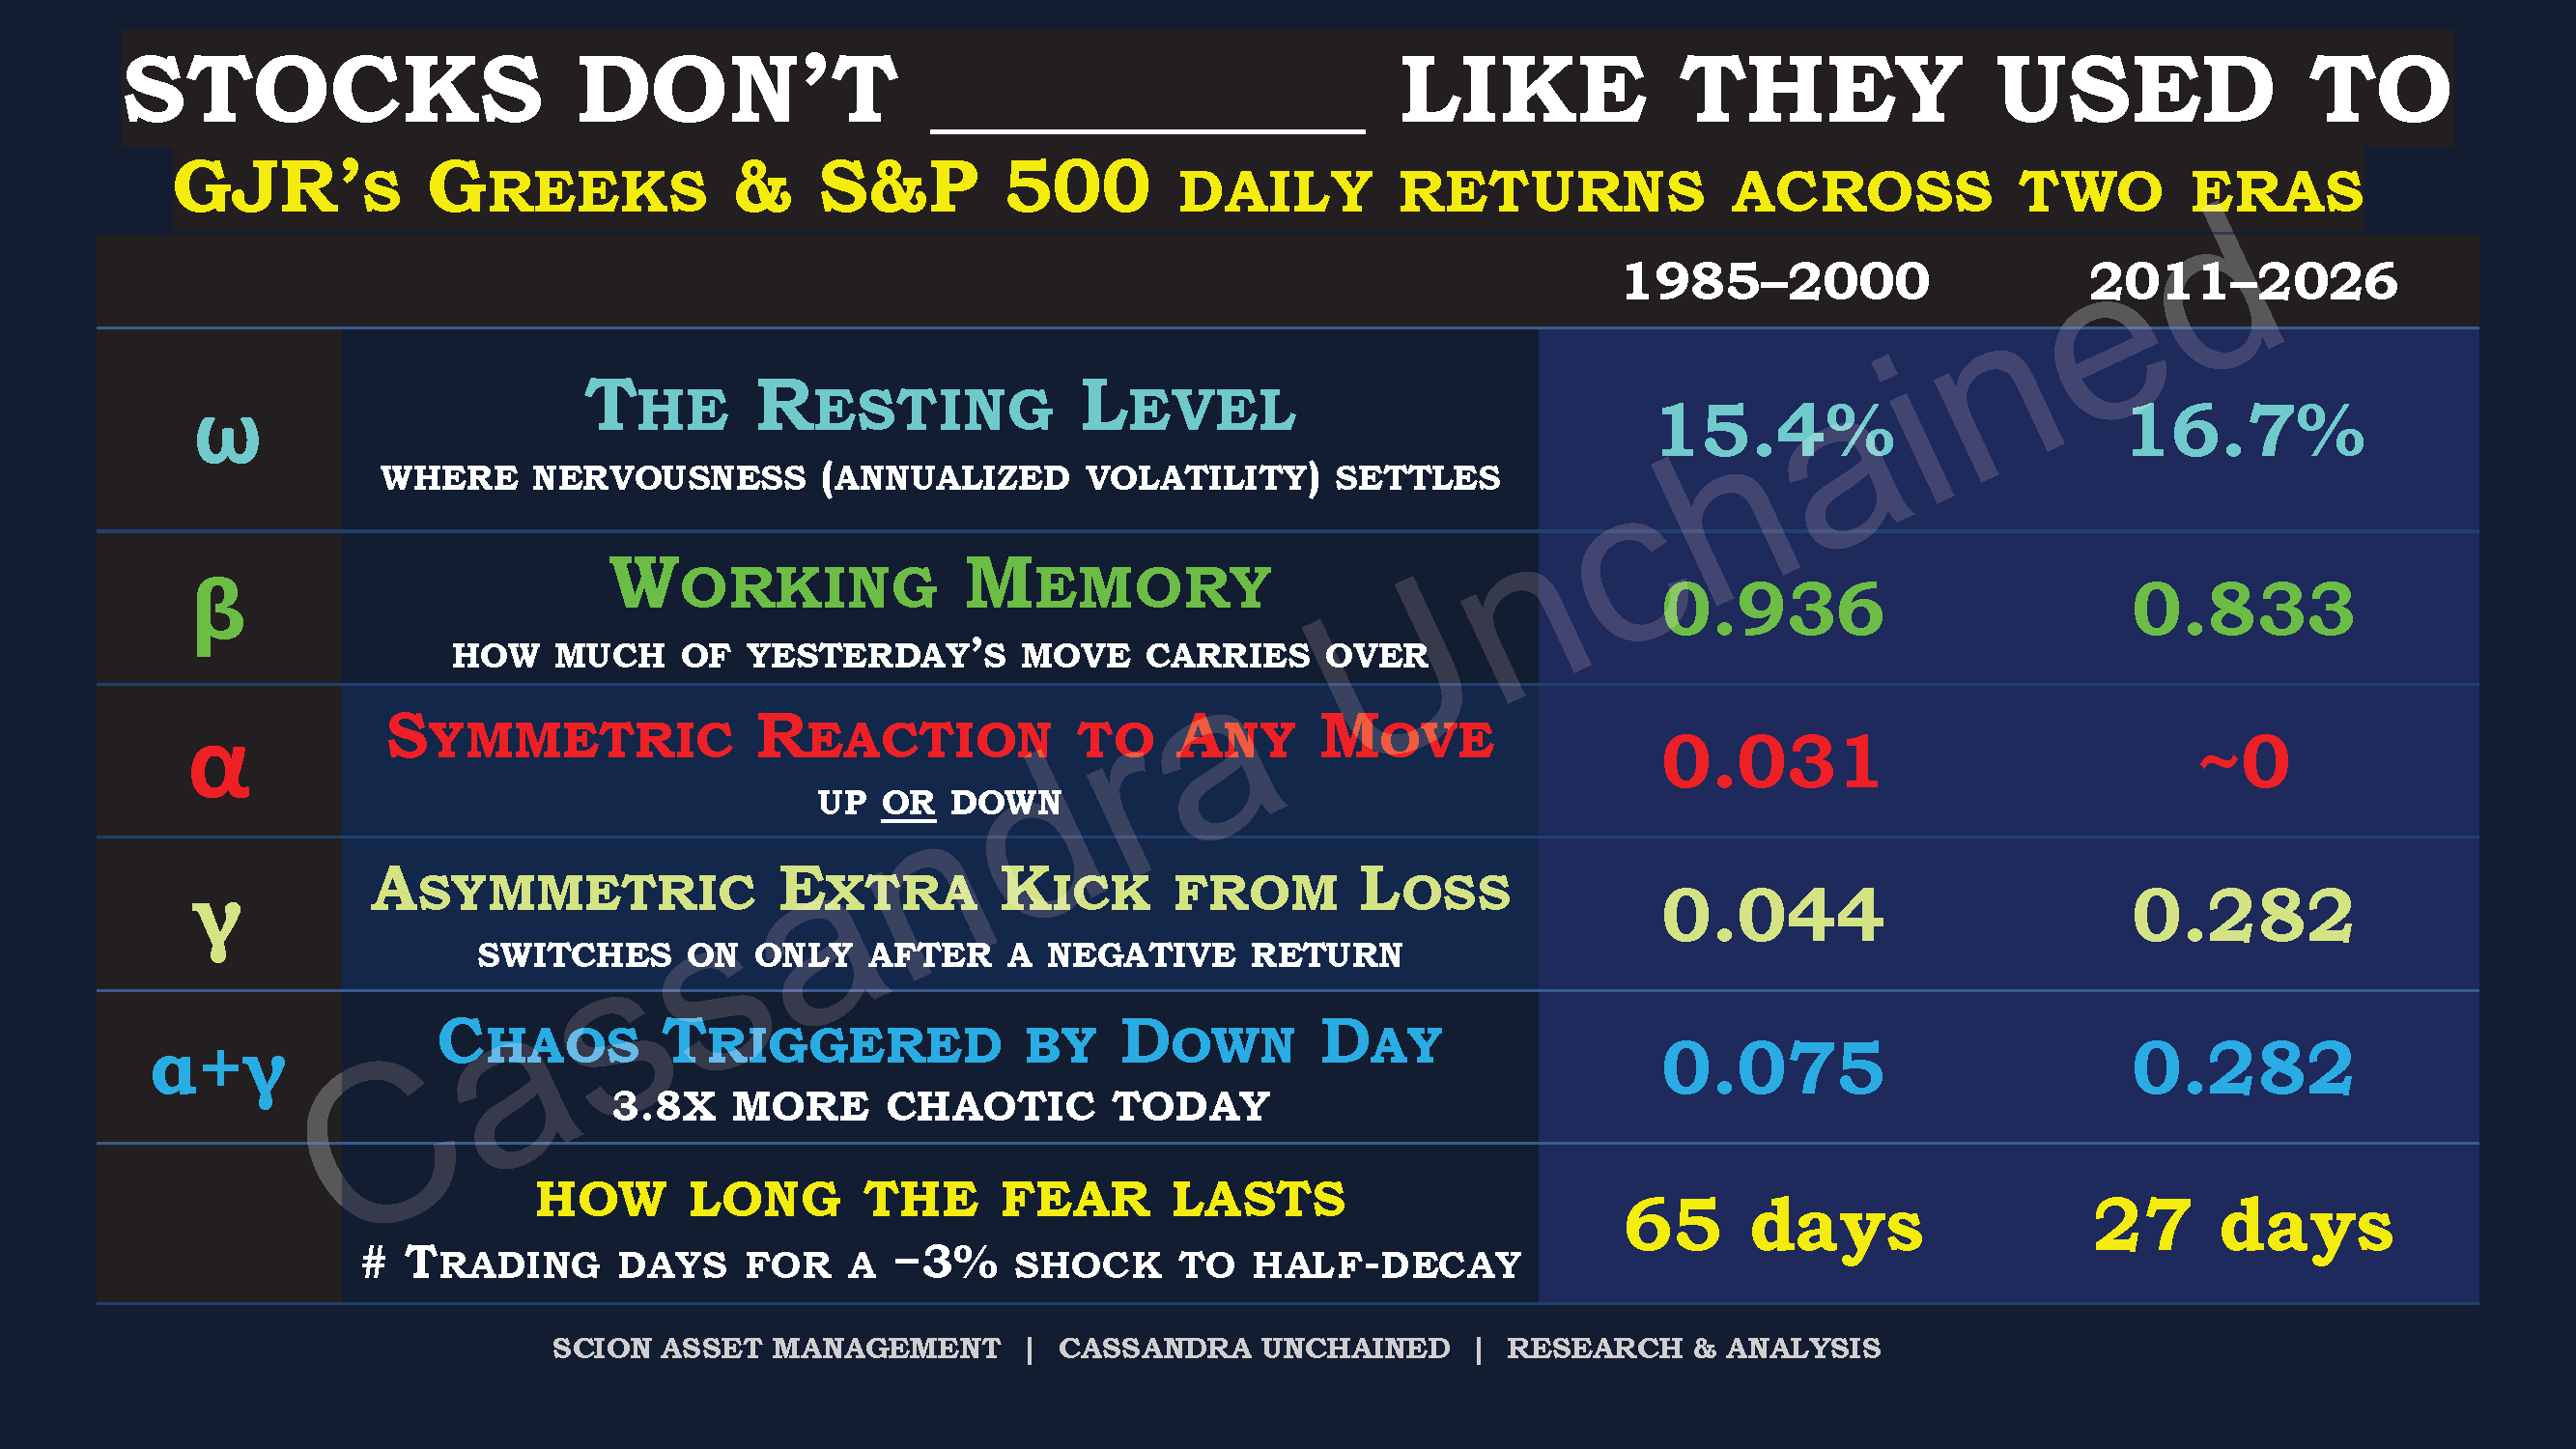
GJR made use of four Greeks known to finance bros. That would be omega (ω), beta (β), alpha (α) and gamma (γ). From now on, for the purposes of this post, when reading “fear” or “nervousness,” think “volatility.” These people who study volatility really mean it.
Omega ω is the resting level, where nervousness settles when nothing is going on. Think of it as the floor, peace, Zen. The market rests a bit more nervously at baseline than in the past.
Beta β is memory, how much of yesterday’s nervousness carries forward. So, higher beta means fear is more sticky and lower beta means fear drains away faster.
Alpha α is how hard the market flinches when there is a big move.
Gamma γ is the extra fear, the asymmetric and out-of-proportion severity of the gut’s wrenching in response to loss.
Gamma is also common sense. It hurts more to lose than it feels good to win, and this is true in just about all things, from sports to love to stocks to you name it.
One cool thing about being old or dead now is that long ago when one was more lively, or alive, one could name obvious things and get tenure for it.
And so, Fischer Black in 1976 described Gamma with respect to markets. Stocks get more volatile after they fall than when they rise by the same amount.
GJR’s 1993 paper is more useful as they provide the formulas I need for the task at hand. The dynamics of resiliency in stocks have changed a lot since I was, ahem, more lively.